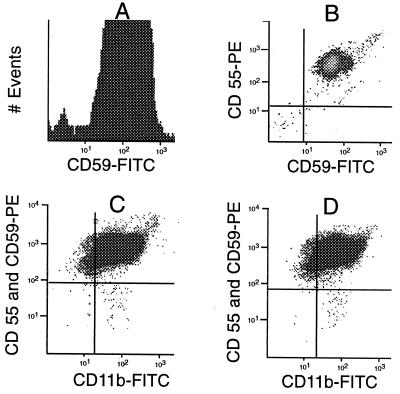
Figure 1.
Development of the Methodology. (A) Histogram of normal granulocytes (donor 1) stained with anti-CD59 and goat anti-mouse FITC. A portion (0.17%) of the cells are CD59(−) (fluorescence <101). (B) Two-dimensional scatter analysis of normal granulocytes (donor 1) stained with anti-CD59 and anti-CD55. Here, 0.04% (400 per million)—seen in the lower left quadrant—express neither antigen. (C) Scatter analysis of granulocytes from donor 8, stained with anti-CD55 and anti-CD59, followed by RAM-PE and then CD11b-FITC. A distinct population of PNH cells is seen in the lower right quadrant at a frequency of 7.5 per million and appears similar to the large PNH clone from patient MSK11 (compare with Fig. 2A). (D) Granulocytes from donor 8 stained in parallel to sample in C. The pattern is virtually identical, and the PNH population is present at a frequency of 9.6 per million, confirming the reproducibility of the assay.

