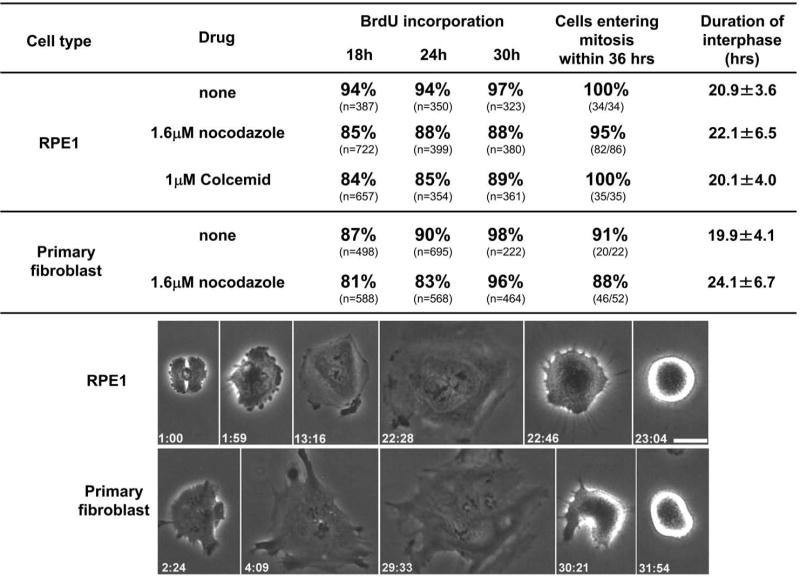
Figure 2.
Interphase cell cycle progression of RPE1 and primary human fibroblast cells without a microtubule cytoskeleton. Upper portion shows the percent BrdU incorporation at the indicated times and the proportion of cells entering mitosis. The “duration of interphase” (mean, ± the standard deviation) is the time from shake off to the rounding up at the subsequent mitosis for cells continuously followed by time lapse video microscopy. First row of images: RPE1 cell progressing from telophase to mitosis without a microtubule cytoskeleton. This cell failed cleavage and was consequently binucleate. Images were taken from Movie 1. Lower row of images: Primary human fibroblast progressing from telophase to mitosis without a microtubule cytoskeleton. This cell failed cleavage and was consequently binucleate. Phase contrast microscopy; hours:minutes from shake off are shown in the lower corners of each frame. Bar = 20μm.

