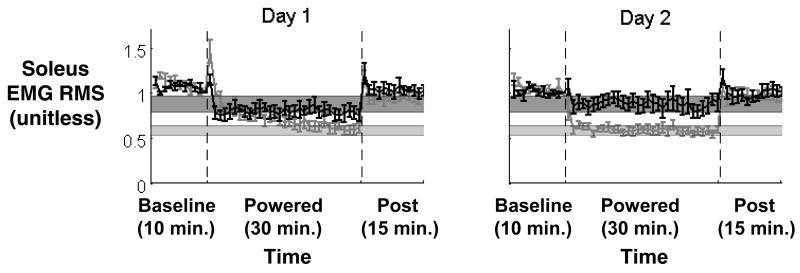
Figure 3.
A comparison of locomotor adaptation to unilateral powered ankle-foot orthoses using two different controllers. Soleus electromyography root mean square (EMG RMS) activity is shown for each minute as mean ± 2 standard deviations across all subjects for each controller. Soleus proportional myoelectric control is shown in grey, and foot switch control is shown in black. Horizontal bars indicate steady state values for each controller (dark grey for footswitch, light grey for myoelectric control). When the orthosis is turned on by placement of the forefoot on the ground (footswitch control), subjects exhibit a smaller decrease in soleus muscle recruitment compared to proportional myoelectric control. Data are from Cain et al 121.

