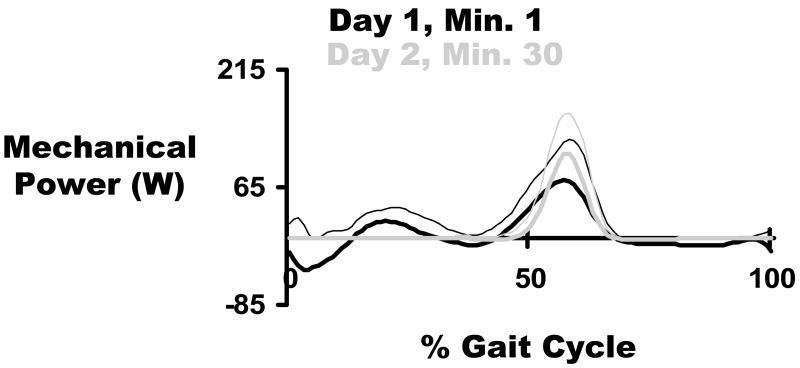
Figure 4.
Orthosis mechanical power walking under soleus proportional myoelectric control. Grey curves are the mean ± standard deviation for all subjects during the first minute of testing on Day 1. Black curves are the mean ± standard deviation for all subjects during minute 30 on Day 2. By the end of Day 2, the orthosis produced almost exclusively positive mechanical power, which was focused at the end of stance. The vertical black line represents the stance-swing transition timing in the gait cycle. Data are from Gordon and Ferris 118.

