
Figure 1.
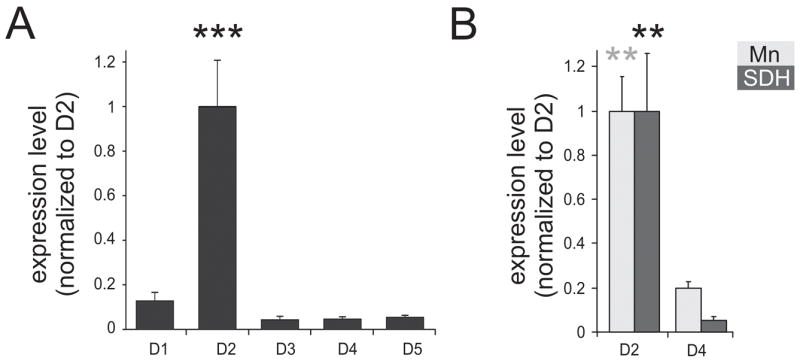
Quantitative real time PCR of dopamine receptors (n = 3). A. Real-time PCR of dopamine receptors in the whole spinal cord. Expression levels are normalized to D2 expression levels. B. Relative expression of D2 and D4 receptor levels in motoneurons (Mn), as identified by retrograde labeling with Fluorogold, and the superficial dorsal horn (SDH) of the lumbar cord. In both regions D2 receptor expression was significantly greater than D4 receptor expression (p=0.002). Values are expressed as mean ± S.E.