
Figure 3.
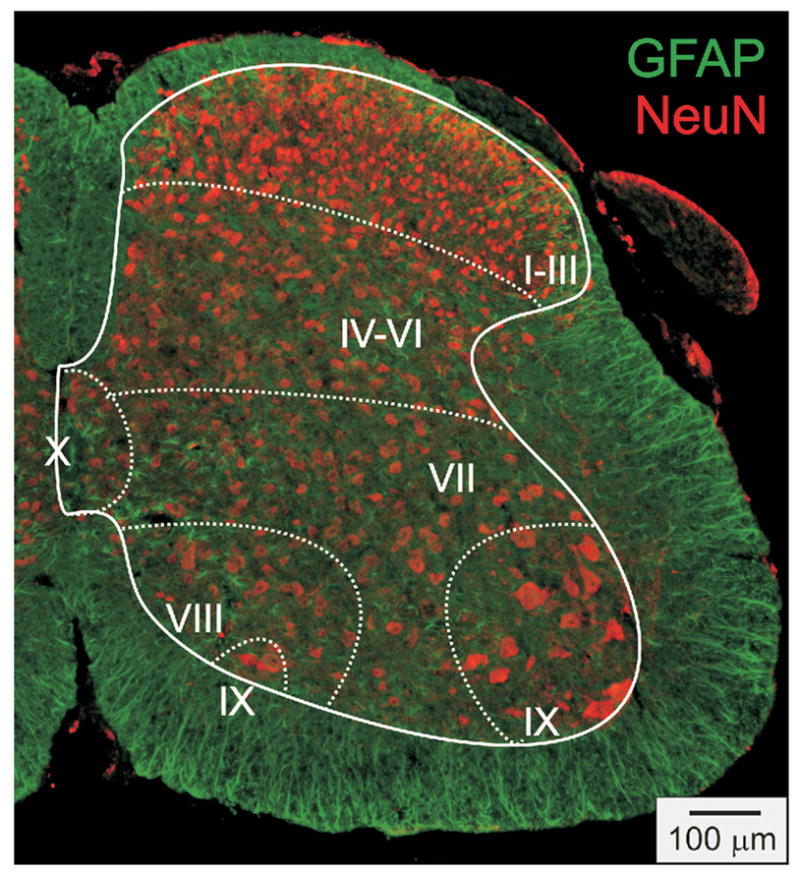
Representative distribution of immunodetected neurons and astrocytes in a section from the lumbar cord. The distribution of labeled neurons is shown with an antibody to the neuron-specific marker NeuN. Distribution of astrocytes is shown using the astrocyte-specific marker GFAP. Surrounding white and internal gray matter are delineated with a solid line. Division of spinal cord into laminae are approximated and separated with dashed lines. Note that in laminae I–III neuronal cell body diameters are generally smaller and cell density is greater than that seen in other laminae. For GFAP, note that labeling is dominant in the white matter, but is also found in gray matter, particularly in the central gray matter.