
Figure 2.
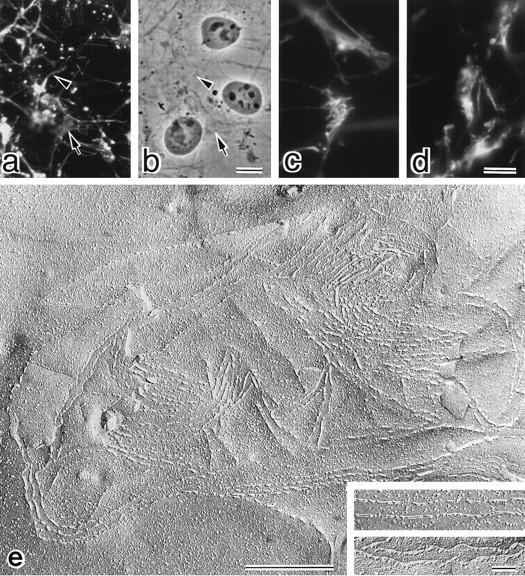
L transfectants expressing FLAG-tagged OSP. (a–d) Immunofluorescence (a) and corresponding phase contrast images (b) of stable L transfectants expressing FLAG-OSP. Cells were stained with anti-FLAG mAb. Expressed FLAG-OSP was concentrated at cell–cell borders as planes (arrow) or on thin cellular protrusions (arrowhead). At higher magnification (c and d), at cell–cell contact planes, FLAG-OSP was concentrated as networks or as thick lines. (e) Freeze-fracture images of cell–cell contact planes of stable L transfectants expressing FLAG-OSP. At low magnification, large numbers of TJ strand/ groove-like structures were observed. These strands scarcely branched, and showed a tendency to run parallel to each other. Inset, higher magnification of strands on P-face (top) and grooves on E-face (bottom). Bars: (a and b) 10 μm; (c and d) 4 μm; (e) 500 nm; (inset) 100 nm.