
Figure 5.
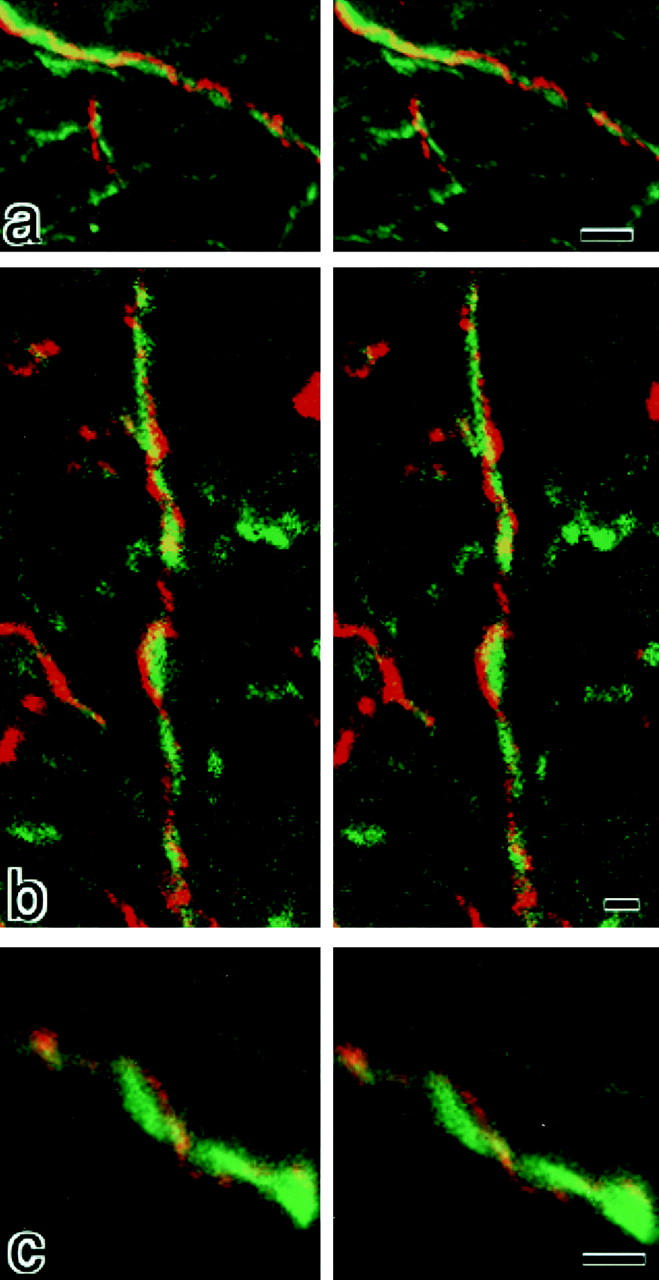
Stereoscopic comparison of subcellular distribution between claudin-11/OSP and neurofilaments. Frozen sections of the brain cortex were doubly stained with anti–claudin-11/OSP pAb (red) and anti-neurofilament mAb (green), examined by confocal microscopy, and stereoscopic images were generated. Note that each claudin-11/OSP-positive linear structure (red) ran in a gentle spiral around a neurofilament-positive axon (green). Bars: (a) 2 μm; (b) 1 μm; (c) 1 μm.