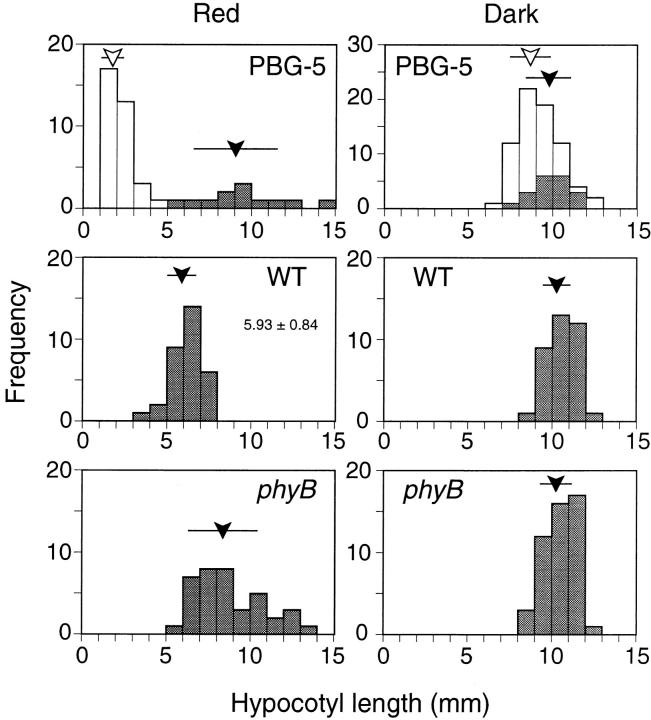
Figure 2.
Frequency distribution of hypocotyl lengths in PBG-5, phyB mutant, and the wild-type seedlings under continuous red light (left) or in darkness (right). Heterozygous progeny of PBG-5 plant was examined. Individuals that exhibited GFP fluorescence are unshaded. Open and closed arrowheads indicate average hypocotyl lengths of fluorescent and nonfluorescent populations, respectively. Bars indicate the standard deviation.

