
Figure 3.
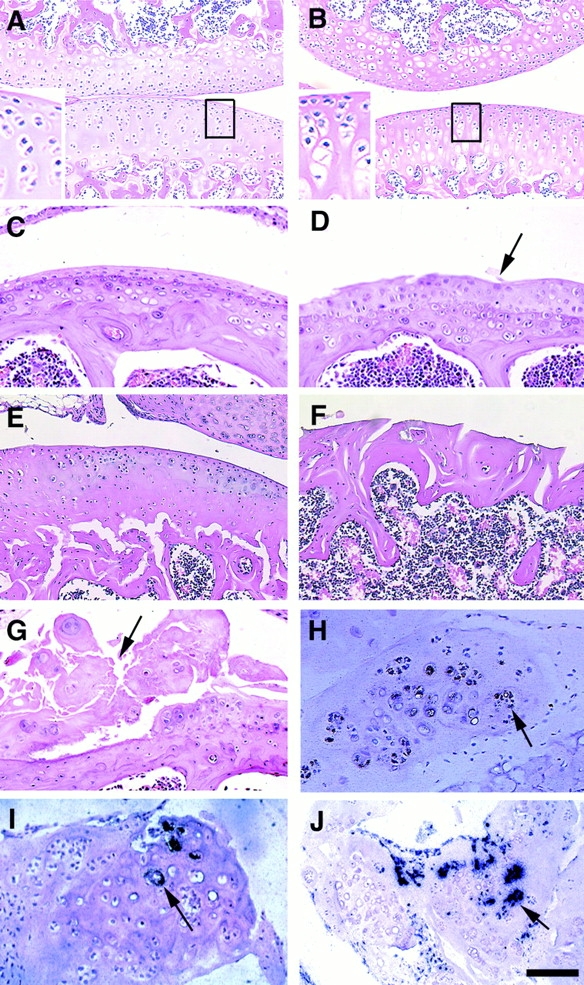
Histologic analysis of articular cartilage of Smad3 ex8/ex8 mice. (A and B) Knee joints of P30 wild-type (A) and mutant (B) mice. Notice the increased number of hypertrophic chondrocytes in mutant articular cartilage. (C–F) Knee joints of 4- (C and D) and 7-mo-old (E and F) wild-type (C and E) and mutant (D and F) mice. Arrow points to abnormally accumulated layer of chondrocytes (D). (G–J) Osteophytes found in synovium of 7-mo-old mice. Arrows point to osteophytes, hematoxylin and eosin (G), collagen type II (H), collagen type I (I), and osteocalcin (J) expression in osteophytes. Bar: (A and B) 150 μm; (C–J) 100 μm.