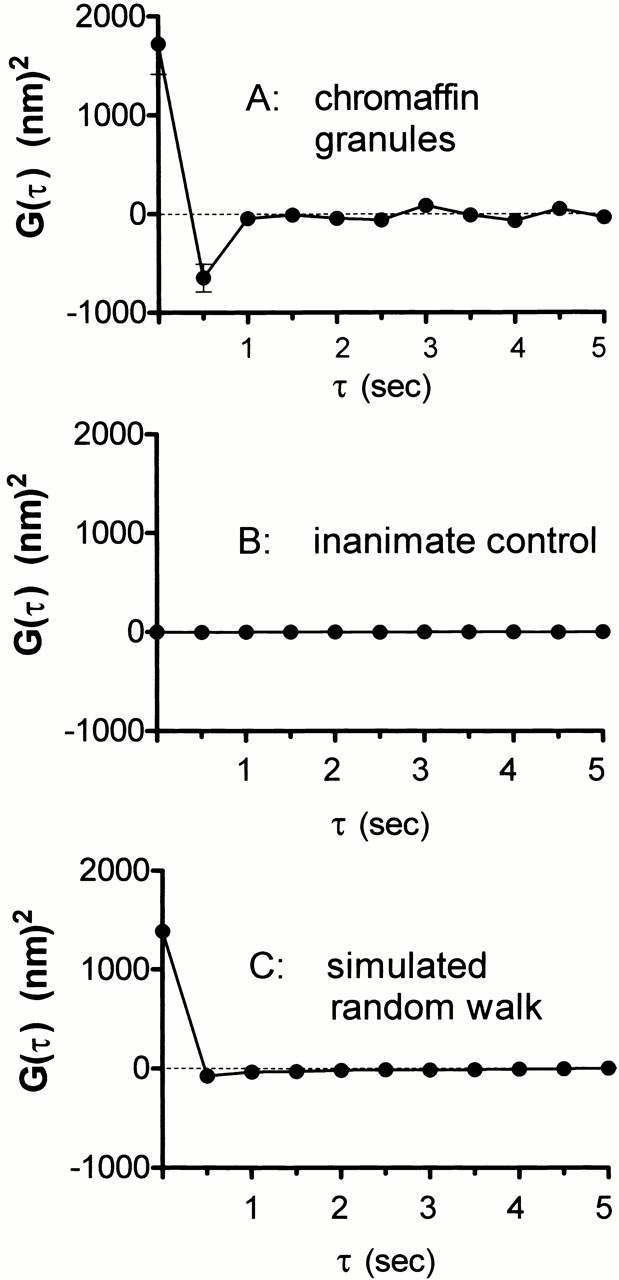
Figure 10.

Autocorrelation of granule velocities. For each granule tracked in two or more consecutive frames, the time sequence of Δz displacements were autocorrelated as in Materials and Methods. The graphs show the mean ± SEM of G(τ) for: (A) granules in basal cells (128 granules from 12 cells), (B) constant intensity light scattering produced by immobile dust particles on a glass coverslip illuminated by an incoherent steady light source (i.e., flashlight), as a test for possible artifactual correlations generated by the instrumentation, and (C) simulated motion of 8,000 “granules” obtained using a random number generator, with the average <(Δz)2> adjusted to match the experimental granule results. Basal and stimulated granules show a tendency (more than would be expected from pure diffusion or a random walk) to reverse direction in the displacement of one interframe step to the next.
