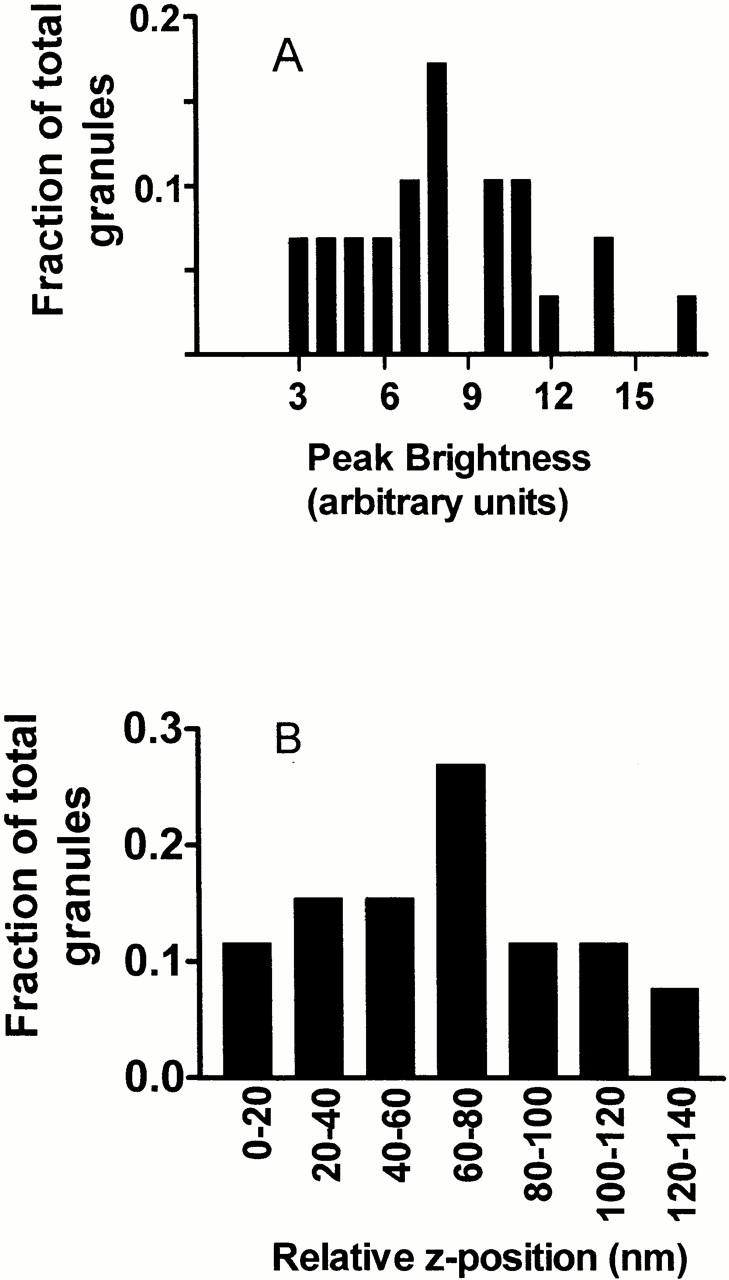
Figure 2.

Histogram of Granule Brightness. (A) Peak intensities of granules obtained from consecutive confocal images expressed as fraction of total granules analyzed (n = 29 granules from two cells). (B) The peak intensities of granules from A, converted here to “relative z positions,” placed into bins of 20-nm width, and expressed as fraction of total granules analyzed (n = 29 granules). The conversion assumes that the intrinsically brightest granules in the histogram would be reported at a (presumably correct) z distance z 0 by the IDL granule identification program, while intrinsically dimmer granules would be (incorrectly) reported to reside at a larger z distance z 1. The difference (z 1 − z 0) is the relative z position plotted as the abscissa here.
