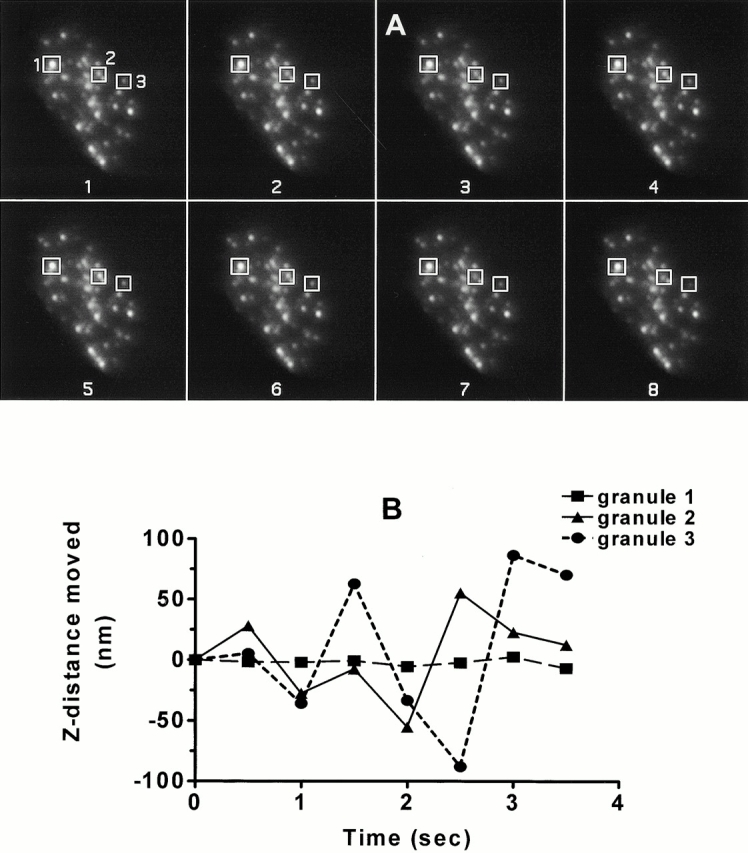
Figure 4.

Granule motion in z plane can be quantitated from changes in fluorescence intensity. (A) Images were taken every 0.5 s for 2 min under basal conditions. Three granules were selected and their movement was monitored over time. The intensities of each granule changed over time, indicating movement back and forth in the z direction. (B) Changes in fluorescence intensity have been converted into the absolute value of changes in distance in nanometers the granule moves every 0.5 s.
