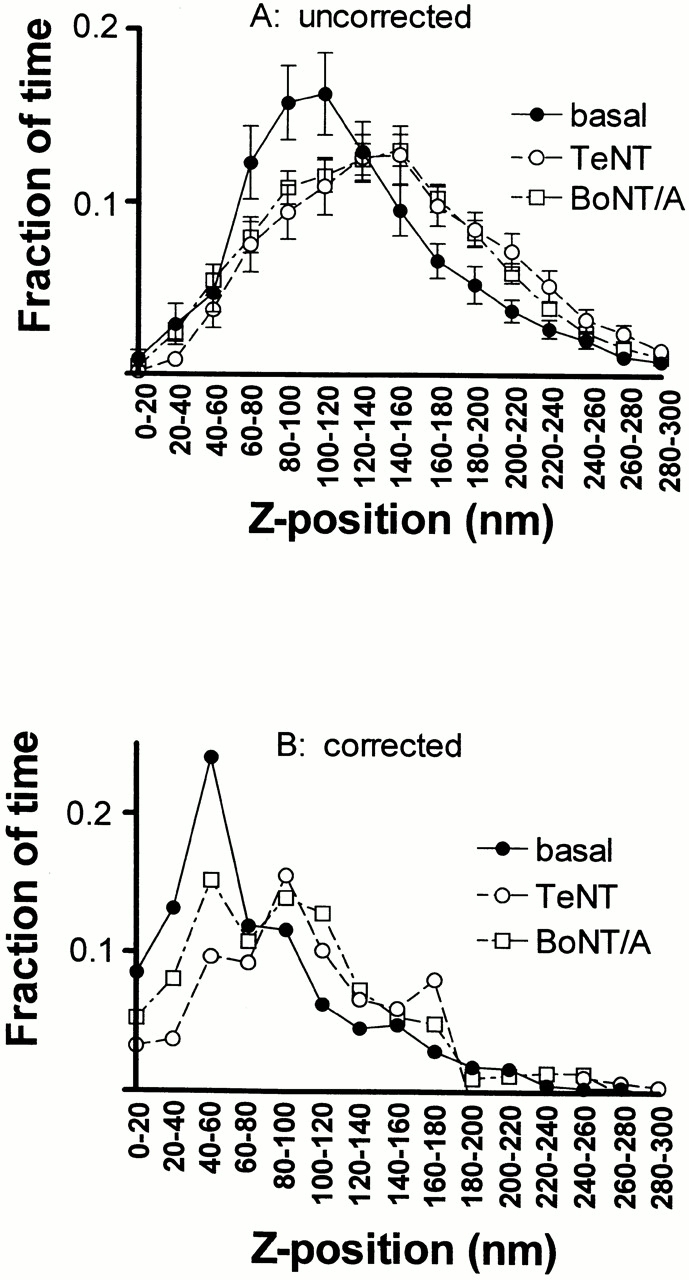
Figure 6.

Fraction of visiting time versus z. For granules that can be continually tracked over at least 40 frames and that covered a total distance of at least 100 nm during this time, the fraction of the number of frames that the granule resides within a particular z-position window is plotted versus z position (divided into 20-nm-wide bins). Values are the mean ± SEM for basal cells (57 granules from 12 cells), TeNT expressing cells (54 granules from six cells), and BoNT/A-expressing cells (149 granules from eight cells). (A) These plots are uncorrected for variations in intrinsic brightness; the abscissa is based directly on . (B) These plots are corrected for variations in intrinsic brightness as described in Materials and Methods.
