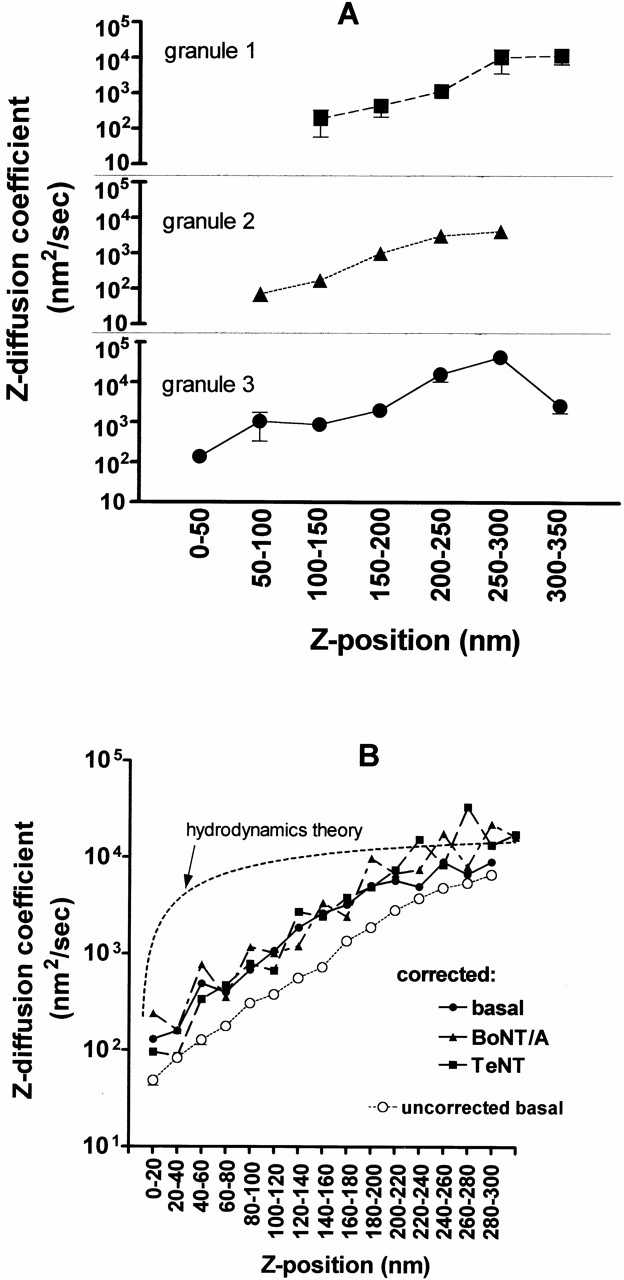
Figure 8.

Rates of granule motion versus z position. (A) Three typical individual granules are tracked by imaging at 0.5-s intervals for 120 s. As each granule visits the indicated z range (as judged by intensity data and ), it displays particular z steps Δz. For each z range visited, the (Δz)2 values are averaged separately for each granule, and a local “diffusion coefficient” is calculated according to . Values for each bin are the mean ± SEM. These three plots show a clear tendency of individual granules to greatly slow their motions (note the log scale of the ordinate) as they approach the membrane (smaller z). (B) All granules appearing in at least two consecutive frames as identified by the IDL program are tracked here. The (Δz)2 values from all the steps of all the granules are pooled together according to the indicated z ranges, and the values within each pool are then averaged. The result is converted to a local diffusion coefficient Δz according to . Values are the mean ± SEM. Several plots are shown here. First, Δz for basal cells (○) is plotted against z values that are not corrected for expected variations in intrinsic granule brightness. In a second group, Δz is plotted against z values that are corrected for intrinsic granule brightness variations, according to the procedure described in Materials and Methods. This second group shows separate plots for: basal cells (•, 12 cells, and 21,090 individual motions, where each point the average of 383–2,934 motions), cells expressing TeNT (▪, six cells, and 9,665 individual motions, where each point is the average of 36–2,060 motions), and cells expressing BoNT/A (▴, eight cells, and 17,938 individual motions, where each point is the average of 64–2,761 motions). These plots all show that Δz smoothly increases with z, with no evidence of discrete steps. The dashed line with no data points is a plot of Δz versus z based on the hydrodynamic theory of Brenner 1961. This is the expected behavior of a 300-nm diameter sphere near a planar surface in an otherwise homogeneous viscous medium. The absolute scale of the theoretical Δz is adjusted to match the approximate experimental Δz values at z = 300 nm. The shape of the theoretical curve is clearly very different from the experimental curves.
