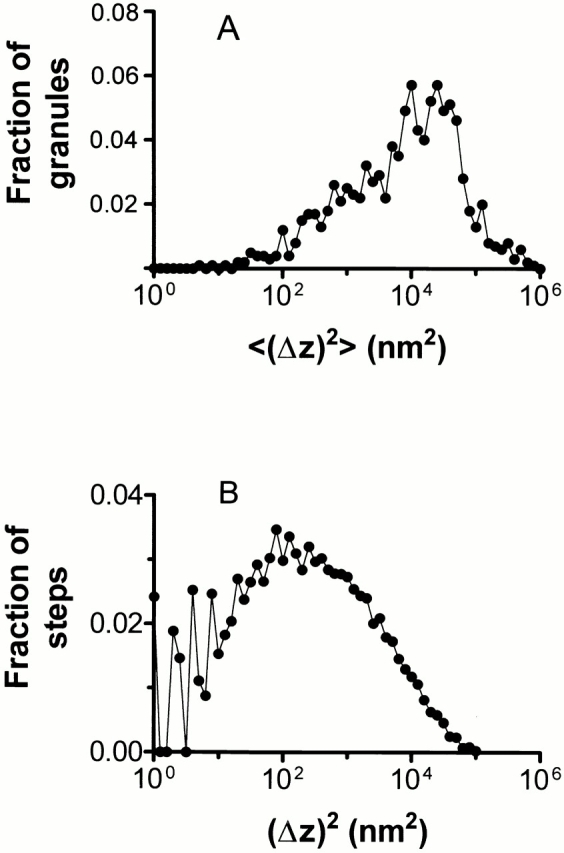
Figure 9.

Histograms of step sizes. (A) For each granule that could be tracked for at least five consecutive frames (997 granules from 12 cells), <(Δz)2> was computed from an average of each interframe step size for that granule, and then allocated into bins of 100.1 width on a log scale of <(Δz)2>. Note that the absolute magnitudes shown on the abscissa can also be read as diffusion coefficients in view of , where the interframe time T = 0.5 s. (B) For all granules appearing in at least two consecutive frames (12 cells, 21,530 individual granule motions), all the individual (Δz)2 values were pooled (regardless of their granule of origin), and then allocated into bins of 100.1 width on a log scale of (Δz)2. Both of these histograms show that there are no distinct groups of slow and fast granules, but rather a broad continuum.
