
Figure 2.
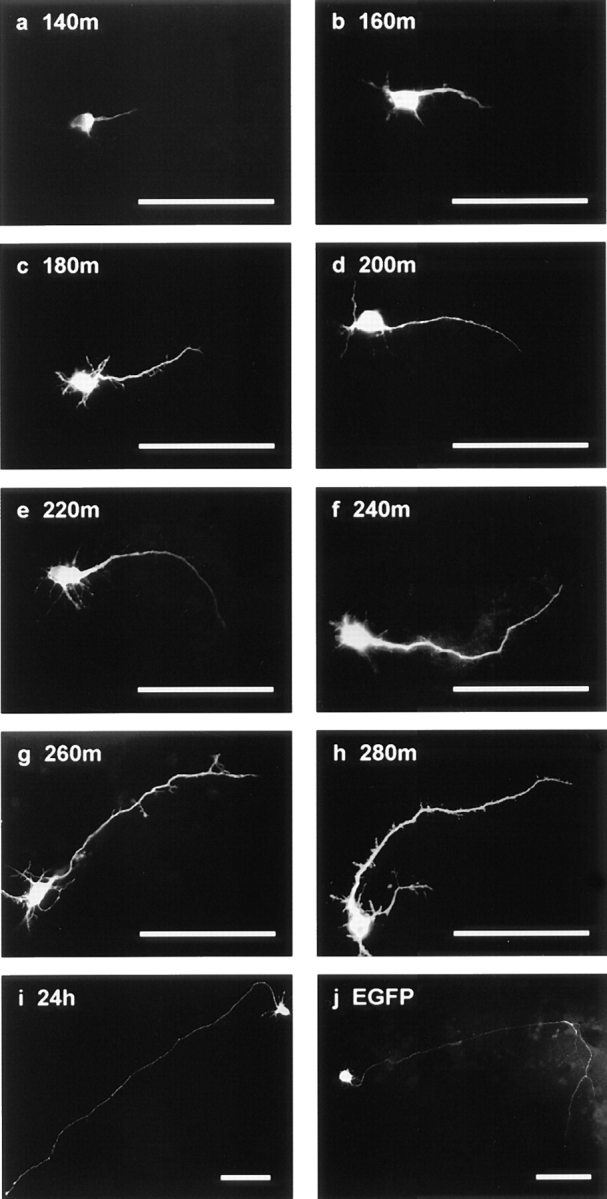
Transport of EGFP-NF-M in transfected cortical neurons. Representative images of EGFP-NF-M–transfected cortical neurons at (a) 140, (b) 160, (c) 180, (d) 200, (e) 220, (f) 240, (g) 260, and (h) 280 min, and (i) 24 h after transfection are shown. (j) Also shown is an EGFP-transfected neuron 240 min after transfection. Bars, 100 μm.