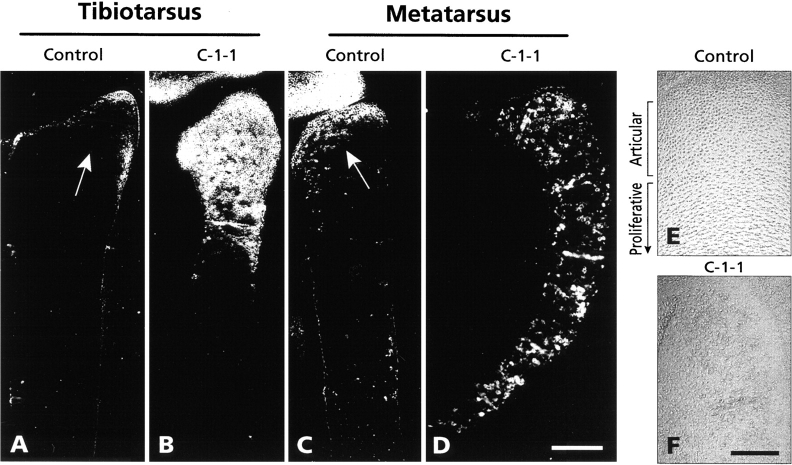
Figure 6.
Immunohistochemical analysis of tenascin-C distribution. Longitudinal sections from control (A and C) and C-1-1 virus-infected (B and D) day 10 chick embryo tibiotarsus and metatarsus were reacted with chick tenascin-C monoclonal antibody and processed for immunofluorescence. Arrows in (A) and (C) point to tenascin-C present in epiphyseal articular layer in control tissue. (E and F) Phase micrographs of epiphyseal portion of control (E) and C-1-1 virus-infected (F) metatarsus. Bars: (A–D) 250 μm; (E and F) 100 μm.

