Figure 9.

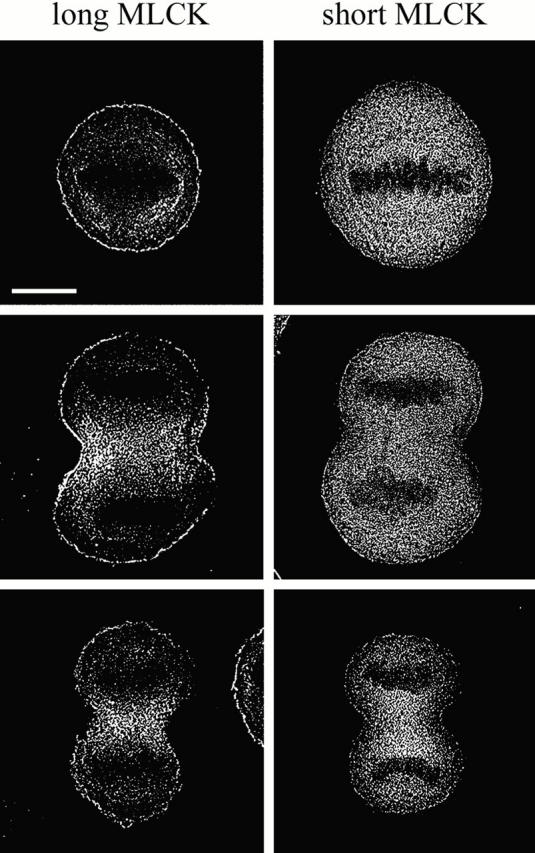
Deconvolved fluorescence micrographs of HeLa cells expressing the avian long or short MLCK-GFPs. The images are representative of cells in metaphase, anaphase, and telophase. Bar, 10 μm.

Deconvolved fluorescence micrographs of HeLa cells expressing the avian long or short MLCK-GFPs. The images are representative of cells in metaphase, anaphase, and telophase. Bar, 10 μm.