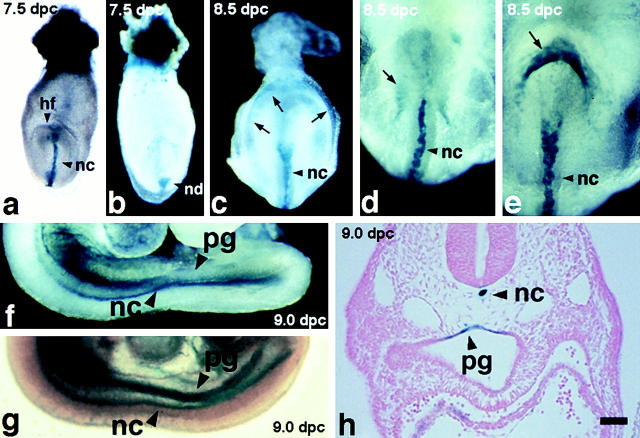
Figure 3.
Expression of the β-galactosidase gene (Krt1-19-lacZ) in the heterozygous mouse embryos at 7.5–9.0 dpc. (a and b) A representative embryo at 7.5 dpc in the anterior and posterior views, respectively. Note the β-galactosidase activity in the notochordal plate, node, and ectoplacental cone. (c) A representative embryo at 8.5 dpc in the posterior view. Note the β-galactosidase activity in an arch pattern (arrows). (d and e) Another embryo at 8.5 dpc in the anterior (d) and posterior (e) views. Note that this embryo is more progressed in development than that in c: the arch pattern of the β-galactosidase staining at the hindgut (e, arrows) is much smaller than that seen in the embryo shown in c. Also note the staining inside the foregut in d (arrow). (f and g) A representative embryo at 9.0 dpc. (h) A transverse section of the same embryo shown in f and g (Eosin counterstaining). hf, head fold; nc, notochordal plate; nd, node; pg, primitive gut. All dissection micrographs (whole mount in situ staining) were taken under a dark-field illumination, except a and g, which were in a bright field. Bar, 100 μm.

