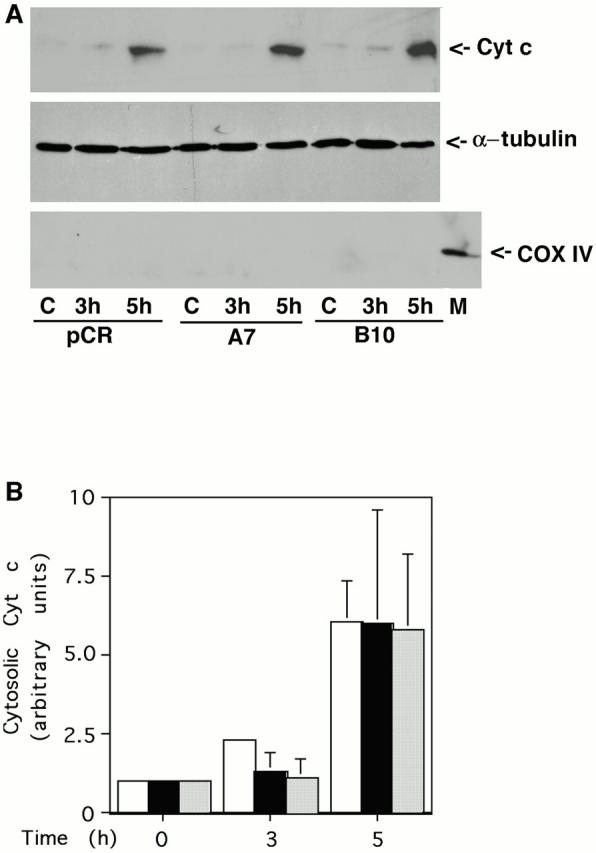
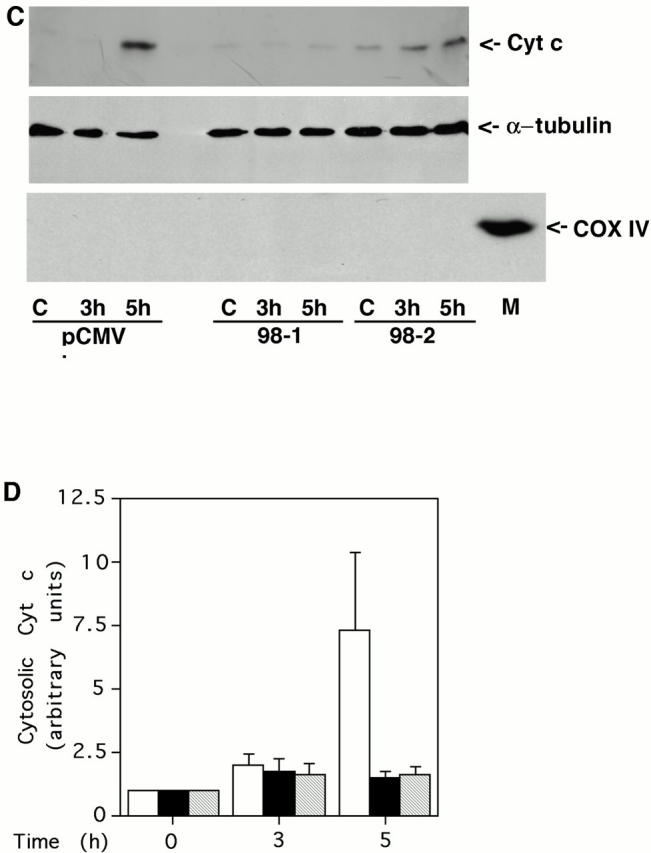
Figure 6.
Bcl-2 but not active Akt blocks cytochrome c release. (A) Active Akt fails to inhibit cytochrome c release induced by C2-ceramide. Vector control line or two independent active Akt lines were treated with 30 μM C2-ceramide for the indicated period. Cells were then fractionated and equal amounts of cytosolic protein were loaded into each lane. The blot was probed with an mAb to cytochrome c (top). For the internal control, the blots were stripped and reprobed with antibody to α-tubulin (middle). The cytosolic fraction was confirmed to be without mitochondria with an mAb to COX IV (bottom; M represents mitochondria as a positive control for COX IV). Data are from a representative experiment performed three times. Note the delay in cytochrome c release is due to cells being treated with 30 μM C2-ceramide in this experiment rather than 50 μM C2-ceramide as used in experiments shown in Fig. 2 C. (B) Quantification of cytochrome c release. Bars: white, pCR vector; black, myr-Akt clone A7; stippled, myr-Akt clone B10. Data represent mean ± SEM of three independent experiments. (C) Bcl-2 inhibits cytochrome c release induced by C2-ceramide. Vector control line or two independent Bcl-2 lines were treated with 30 μM C2-ceramide for the indicated period. Cells were then fractionated and equal amounts of cytosolic protein were loaded into each lane. The blot was probed with an mAb to cytochrome c (top). For the internal control, the blots were stripped and reprobed with antibody to α-tubulin (middle). The cytosolic fraction was confirmed to be without mitochondria with an mAb to COX IV (bottom; M represents mitochondria as a positive control for COX IV). Data are from a representative experiment performed three times. (D) Quantification of cytochrome c release. Bars: white, pCMV vector; black, hBcl-2 clone 98-1; stripped, hBcl-2 clone 98-2. Data represent mean ± SEM of three independent experiments.