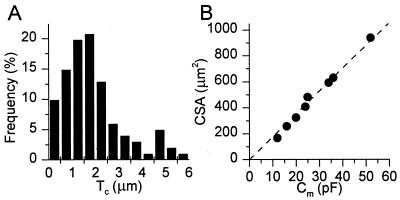
Figure 1.
Dimensions of CPAE cells. (A) Histogram of Tc values of nondialyzed CPAE cells in isotonic solution. Pooled data from 101 Tc determinations on 76 cells. (B) Correlation between CSA and Cm for eight whole-cell patch-clamped cells. The broken line represents the best linear fit, with a slope of 17.6 μm2/pF (r = 0.996). Note that these cells cover the whole range of CSA and Cm values observed in this study.

