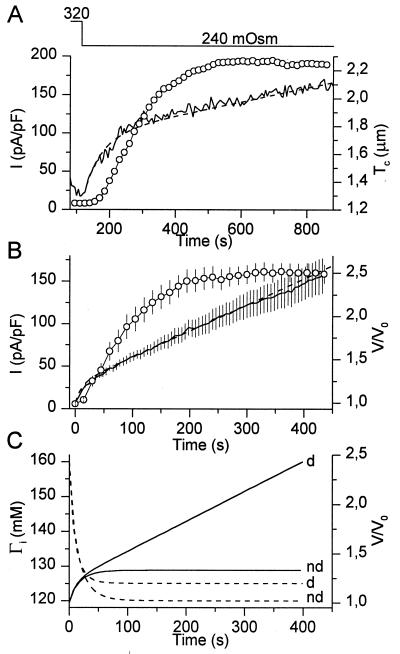
Figure 3.
Changes in Tc and ICl,swell during a prolonged reduction of OSMo. (A) Changes in Tc (solid line) and ICl,swell (circles) as OSMo was lowered from 320 to 240 mOsm. (B) Average current density (circles) and relative volume V/V0 (solid line) during a 450-s reduction of OSM0 from 320 to 240 mOsm (n = 10). The broken line in A and B represents the best fit of the model. In this panel, time 0 corresponds to the time at which OSMo was reduced. (C) Model prediction of V/V0 (solid lines) and Γi (broken lines) for dialyzed (d) and nondialyzed (nd) cells.

