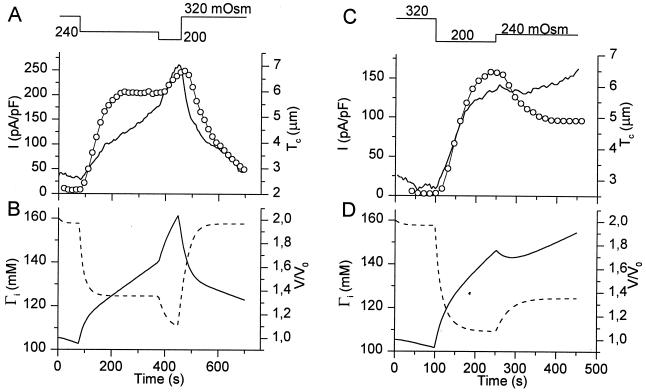
Figure 4.
Comparison of experimental data of Tc and ICl,swell with model predictions of V/V0 and Γi during stepwise changes in OSMo. (A) Tc (solid line) and ICl,swell (circles) as OSMo is stepped first to 240 mOsm and thereafter to 200 mOsm. (B) Model prediction of cell volume (solid line) and Γi (broken line) for the experiment shown in A. (C) Tc (solid line) and ICl,swell (circles) as OSMo is stepped first to 200 mOsm and thereafter to 240 mOsm. (D) Same as B for the experiment shown in C.

