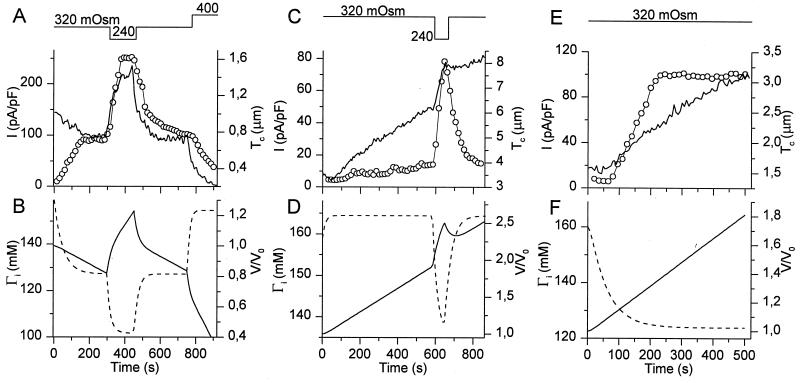
Figure 5.
Tc and ICl,swell in cells dialyzed with pipette solutions with altered osmolality and/or salt content. (A) Activation of ICl,swell (circles) without any increase in Tc (solid line) in a cell dialyzed with a low-salt pipette solution (Γp = 125 mM; 290 mOsm), further activation of ICl,swell by reducing OSMo to 240 mOsm and inactivation of ICl,swell by increasing OSMo to 400 mOsm. (B) Model prediction of V/V0 (solid line) and Γi (broken line) for the experiment shown in A. (C) Increase in Tc (solid line) without significant activation of ICl,swell (circles) in a cell dialyzed with a high-salt pipette solution (Γp = 195 mM; 365 mOsm). Reducing OSMo to 240 mOsm causes further cell swelling and activation of ICl,swell. (D) Same as B for the experiment shown in C. (E) Increase in Tc (solid line) and activation of ICl,swell (circles) in a cell dialyzed with a hypertonic pipette solution with normal salt content (Γp = 155 mM; 365 mOsm). (F) Same as B for the experiment shown in E.

