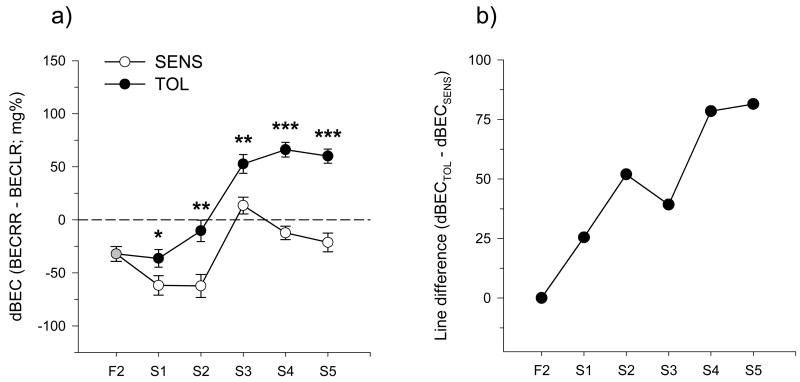
Figure 1.
Mean values for dBEC collapsed across sex in the tolerant (filled symbols) and sensitive (open symbols) lines (panel a). Panel b shows the selection differential for dBEC between the tolerant and sensitive lines. Asterisks indicate significant effects of selection line at each generation: ***, p<0.001; **, p<0.01; *, p<=0.05

