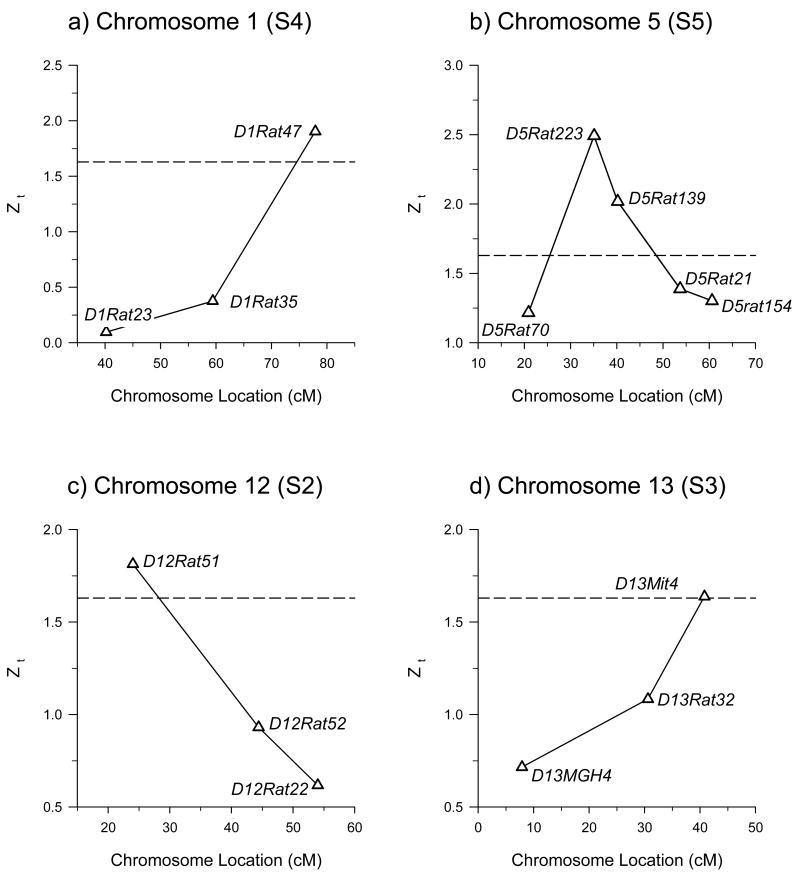
Figure 4.
QTL maps for dBEC on chromosomes 1, 5, 12, and 13. Marker position is shown as a function of the normal deviate (Zt) of δ for the most advanced generation that showed a significant difference in δ (generation shown in parentheses). Horizontal dashed line is the nominal significance threshold (Zt=1.63, p<0.05). Marker positions are from the Rat Genome Database (rgd.mcw.edu), SHRSP X BN cross.

