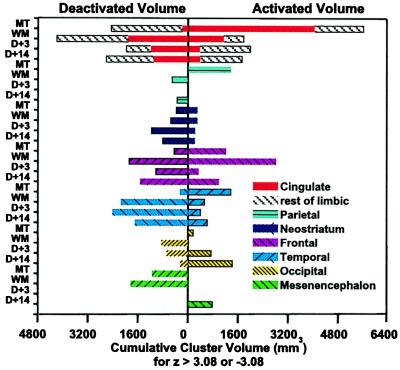
Figure 2.
The volume (mm3) of the regional activations and deactivations observed in each brain region during maximum thirst, 5 min after wetting the mouth, 3 min after drinking to satiation, and 14 min after drinking to satiation are shown as a stacked bar graph. “Rest of limbic” refers collectively to the parahippocampal and insula cortex and amygdala and also includes the thalamus. The activation volumes were determined by adding all voxels with Z score >3.08 and deactivation by adding voxels with Z score <−3.08. MT, maximum thirst; WM, wet mouth; D + 3, 3 min after drinking water to satiation; D + 14, 14 minutes after drinking water to satiation.

