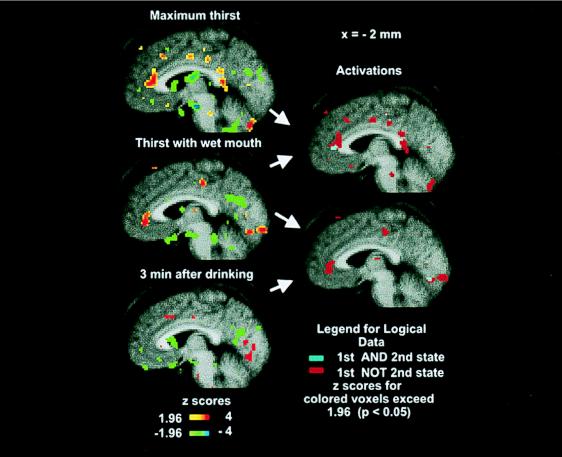
Figure 3.
(Left) The PET activations (saggital section x = −2) of the average brain of the 10 subjects where initial resting non-thirsty state is compared with maximum thirst (Top), 5 min after wetting the mouth (Middle), and 3 min after drinking to satiation (Bottom). Only significant activations (Z > 1.96) and deactivations (Z < −1.96) are shown as per color bars. (The color coding of Z scores is shown on the figure.) (Right) Logical images formed by logical AND (cyan: present in both) of two activation statistical images, and logical NOT (red: present in first but not second) of the two activation images as indicated by arrows. Each logical image is formed from two statistical images as indicated by the arrows on the right of the statistical images.

