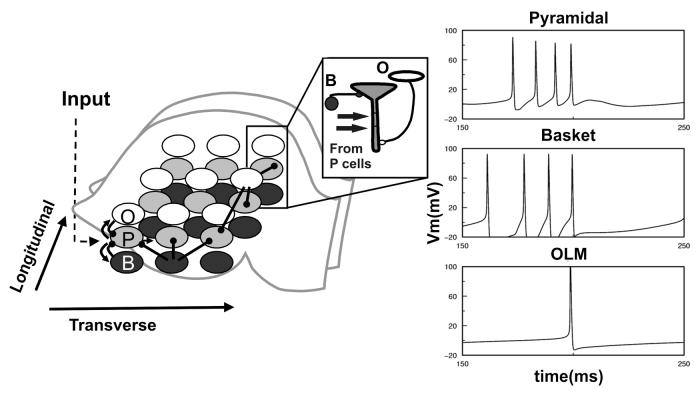
Figure 2.
Left. Network schematic (O- OLM, P- Pyramidal, B- Basket cells), arrows represent excitatory connections, filled circles - inhibitory. First cell in a row is externally stimulated (Input). Inset. Scheme of P cell synaptic inputs. Right. Firing of pyramidal soma (top), basket (middle) and OLM cells (bottom) at the same spatial location in the network during theta-gamma regime. Duration of only one theta cycle is shown to illustrate temporal interactions between network elements.

