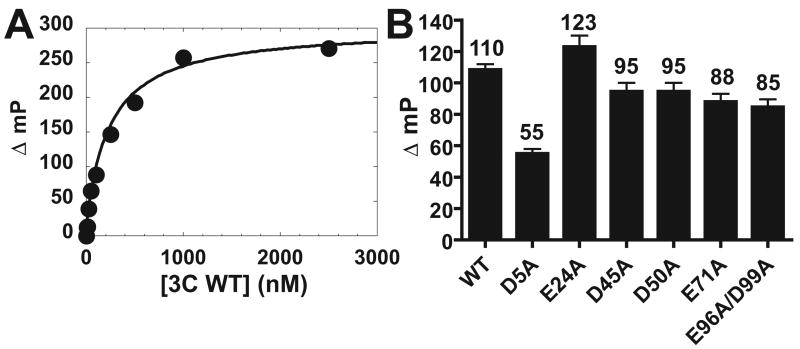
Figure 7. OriI binding by selected PV 3C derivatives.
A. OriI binding by WT 3C. 3′-fluorescein-labeled oriI RNA (29-nt) was titrated with 3C. Binding was measured by monitoring the change in fluorescence polarization (Δ mP). The data were fit to a hyperbola. The Kd value is 260 ± 40 nM. B. OriI binding by 3C derivatives. 3C protein (150 nM) was mixed with 3′-fluorescein labeled oriI RNA and the change in polarization (Δ mP) was measured. The results are the average of three independent binding experiments with error bars indicating the standard deviation.

