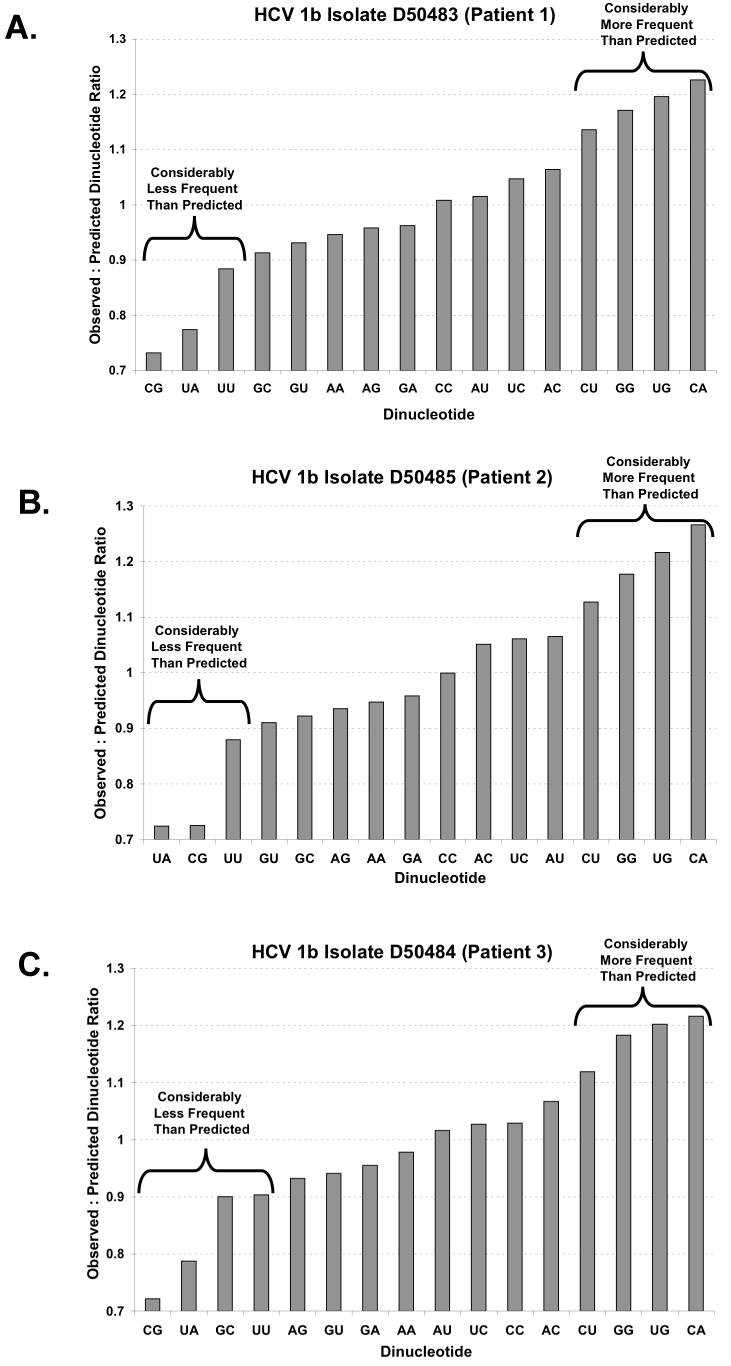
Figure 1. Observed to predicted dinucleotide ratios in HCV RNA ORFs.

A-C There are 16 potential dinucleotides in an ORF (x-axis). The ratio of observed to predicted dinucleotide frequency (y-axis) was calculated (as described in Methods, Method 1) for three interferon-resistant HCV 1b isolates (Enomoto et al., 1995). Ratios below 1.0 correspond to fewer observed dinucleotides than predicted while ratios above 1.0 correspond to more observed dinucleotides than predicted by the base composition of the codon position.
