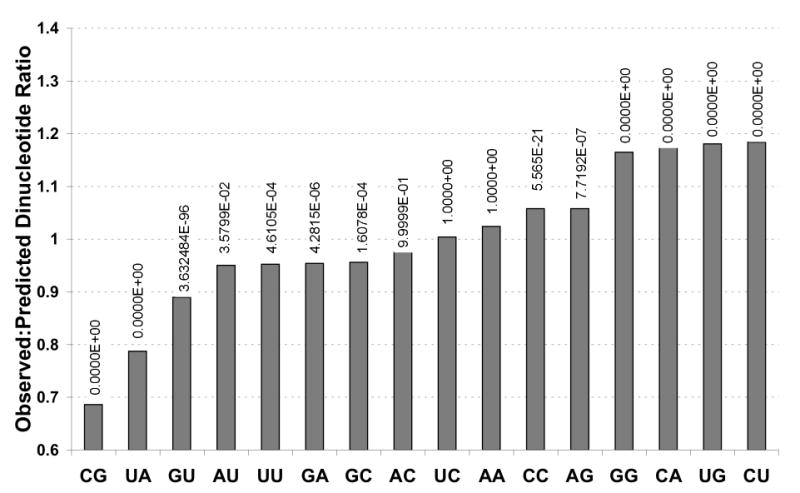
Figure 3. Observed to predicted dinucleotide frequencies in composite dataset.

A statistical analysis was performed to test whether the observed frequency of each dinucleotide was equal to the predicted frequency (for all ORFs simultaneously). The p-values for each dinucleotide are indicated in the graph (0 means that it is less than 10-300). For all dinucleotides except “AC”, “UC”, “AA”, the observed frequencies are significantly lower (“CG”, “UA”, “GU”, “AU”, “UU”, “GA”, “GC”) or higher than expected (“CC”, “AG”, “GG”, “CA”, “UG”, “CU”) at the 0.05 level.
