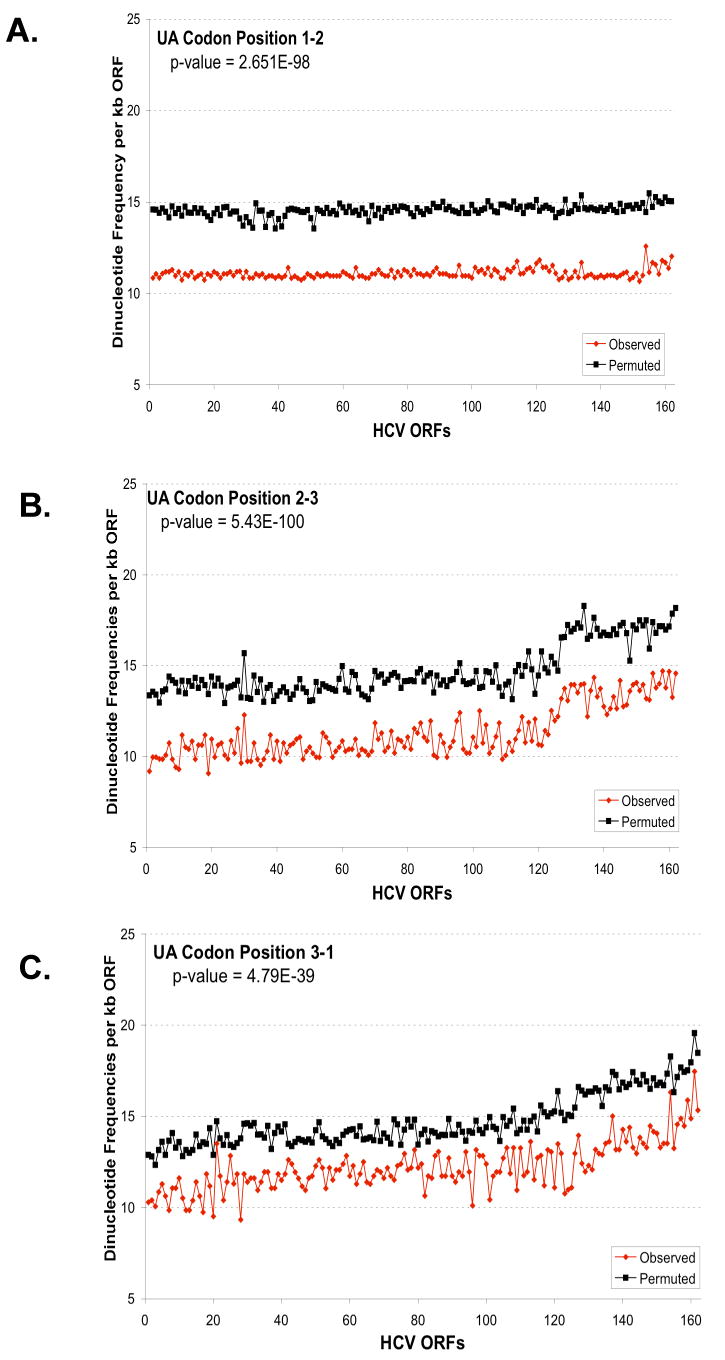
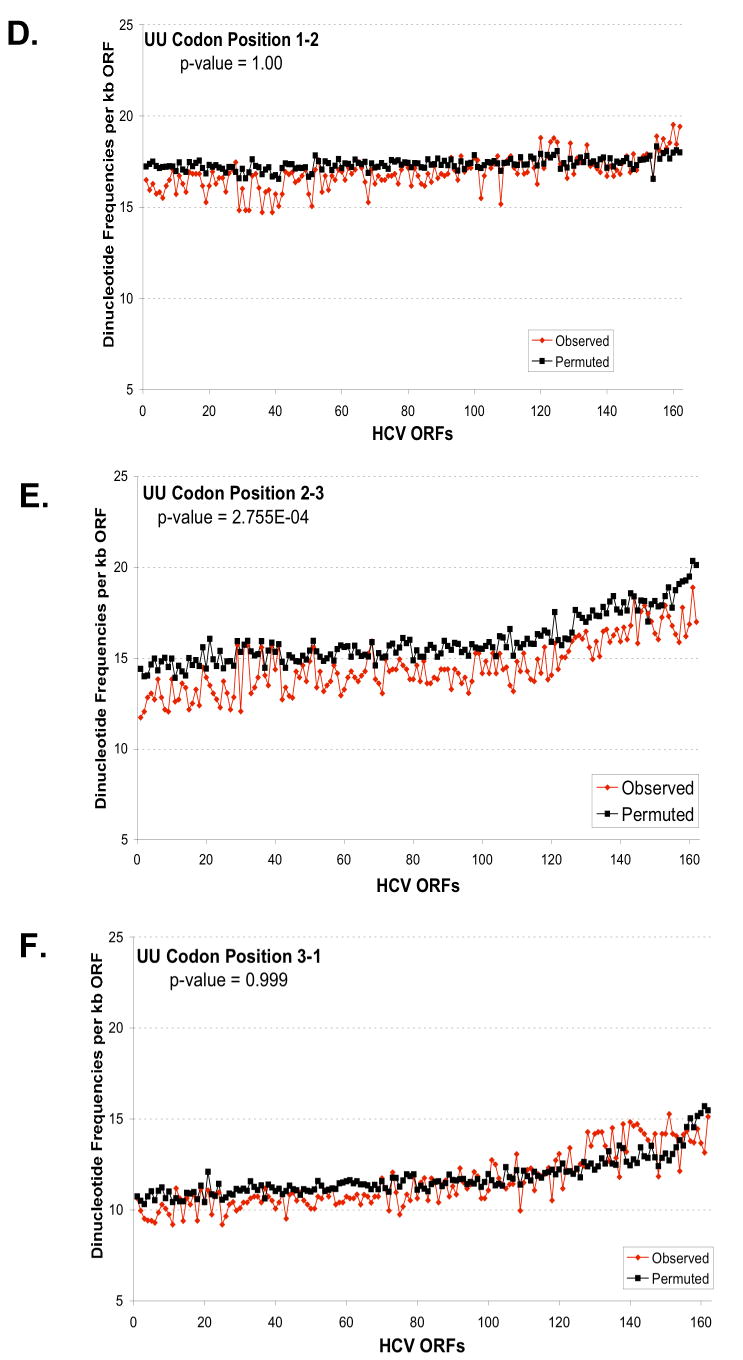
Figure 6. Predicted and observed UA and UU dinucleotide frequencies based on codon position.


The predicted and observed UA (A-C) and UU (D-F) dinucleotide frequencies were plotted versus codon position: codon position 1-2 (A, D); codon position 2-3 (B, E); and codon position 3-1 (C, F). The frequencies per kb of ORF (y-axis) were plotted versus the order of strains established in Figure 5 (x-axis). Predicted dinucleotide frequencies were obtained using permuted sequences as described in Methods (Method 3). The aggregate results for all strains for each codon position were analysed to evaluate the null hypothesis that the predicted and observed frequencies are the same. The p-values from this test are displayed in each figure. For UA, the observed frequency is significantly different than the predicted for all positions (p-value < .01). While for UU, the observed frequency is only significantly different for position 2-3 (p-value < .01).
