
Figure 3.
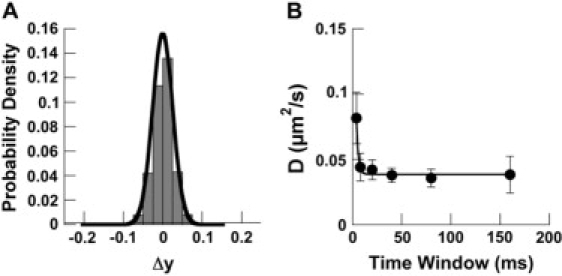
Measurement of diffusion of microbeads. (A) Distribution of y-displacement (Fig. 1) of noninteracting microbeads in shear flow. The population of displacements is normally distributed with mean 0 μm and standard deviation 0.025 μm (p < 0.05). Displacements of exactly zero are included in the 0+ bin. (B) The diffusion coefficient of the microbead was calculated from the RMS displacement in the y-direction using the equation 〈y2〉 = 2Dt. Because of interpolation limits in our tracking program, 4 ms time intervals were too small to measure Brownian motion, inflating the diffusion coefficient. By expanding the time window, we were able to compute a diffusion coefficient of 0.038 μm2/s. Data shown are the result of at least 15 microbeads (mean ± SE).