
Figure 2.
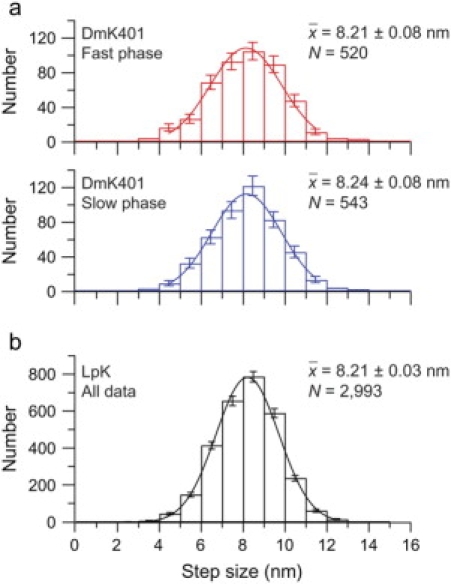
Step size distributions and Gaussian fits. (a) DmK401 histograms of sizes for the fast (red bars) and slow (blue bars) phases with superposed Gaussian fits (solid lines); bin width 1 nm; statistical errors as indicated. Best fit values (μ ± σμ) are 8.19 ± 0.09 nm (red) and 8.22 ± 0.08 nm (blue). (b) LpK distribution of all step sizes (black bars with statistical errors). Data are fit to a Gaussian (solid line) with 8.22 ± 0.03 nm (μ ± σμ). All fits were restricted to bins with ≥10 counts. Legends display sample averages mean ± SE.