
Figure 5.
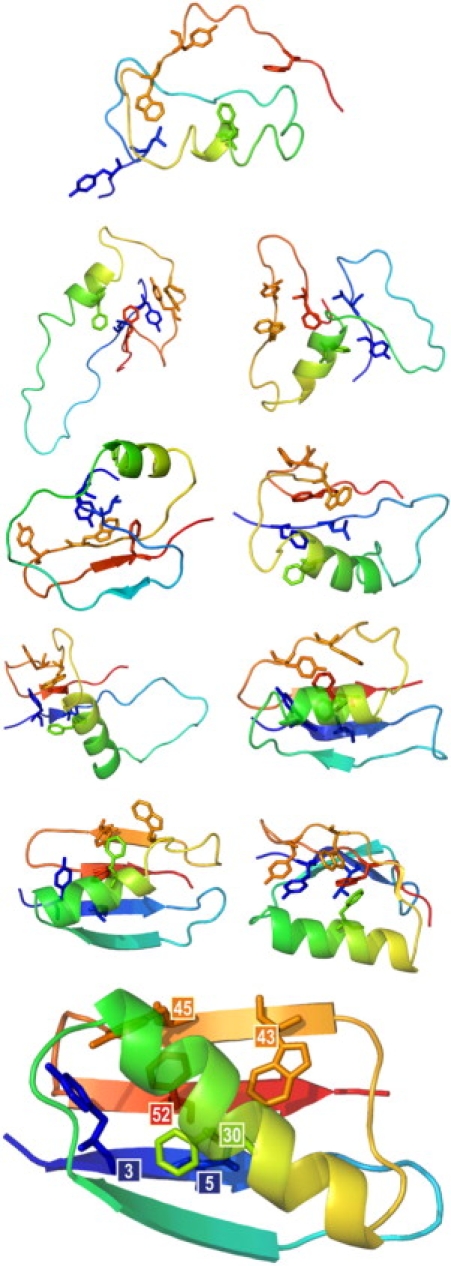
Multiscale modeling: example snapshots from a simulation presenting interactions of the nucleus side chains at various folding stages. Heavy atom bonds of the nucleus residues are marked with colored sticks; the secondary structure is depicted using transparent ribbons. Models were reconstructed from the reduced representation and refined by the procedure described in the Methods section. Afterward, the secondary structure was assigned by the DSSP algorithm (55). At the bottom, the experimental structure of protein G is drawn for comparison with the nucleus residues labeled by their position in the sequence. Pictures of models were drawn using PyMOL (56).