
Figure 3.
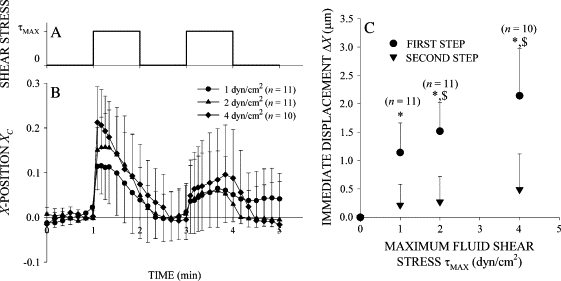
Stress amplitude dependence of the leukocyte response to fluid shear. (A) Time course of FSS exposure. (B) Leukocyte recoil in a fluid shear field. Normalized X-position of the cell centroid of freshly isolated leukocytes exposed to FSS with peak values on the cell surface of τMAX = 1, 2, and 4 dyn/cm2. (C) Leukocyte stiffening response. The immediate displacement in response to a step increase in FSS increased with τMAX but decreased with subsequent shear stress steps. (*) indicates a statistically significant difference (p < 0.05) in immediate displacement between the first and second steps. ($) indicates a statistically significant difference (p < 0.05) in immediate displacement compared to τMAX = 1 dyn/cm2. The number of observations, n, is given in the legend.