
Figure 5.
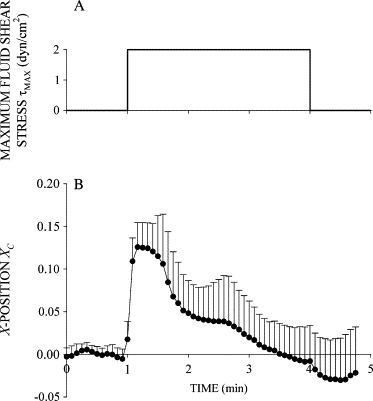
(A) Time course of FSS application for a single step increase in fluid discharge from the pipette of 3 min duration. (B) Normalized X-position of the cell centroid XC shown as a function of time during 3 min exposure to FSS. With longer FSS application, cells eventually recoil back to their initial position and even move toward the pipette. Data are the mean and standard deviation of 10 observations.