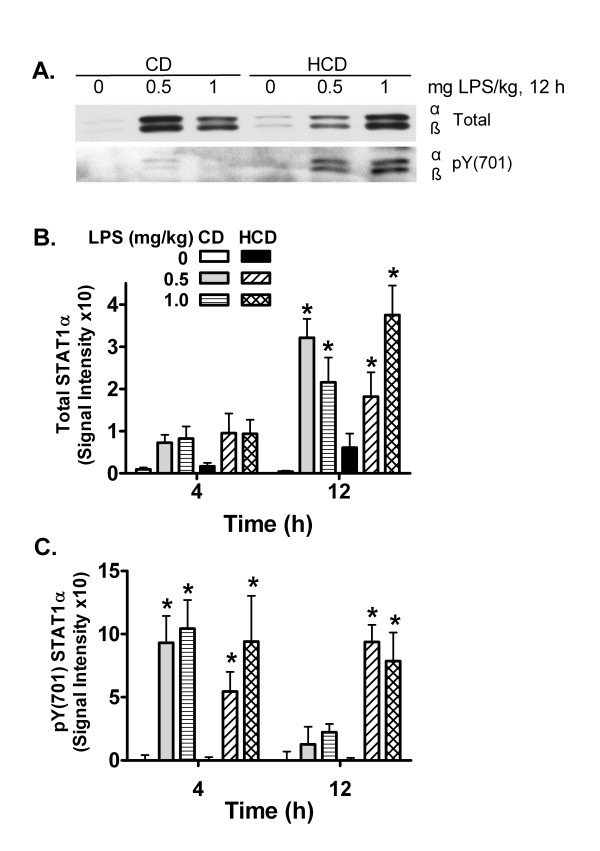
Figure 6.
The effect of diet and LPS on STAT1 activation in liver. Total and tyrosine 701 phosphorylated (pY701) STAT1 protein levels in hepatic tissues from CD and HCD mice were measured by western blotting. A representative image from samples 12 h after LPS treatment is shown in panel A. STAT1α and the shorter β form are visible. Densitometric intensity of total and pY701 STAT1α was measured and means + SE of 5 mice fed each diet 4 and 12 h after treatment were calculated (B and C). *: p < 0.05 for comparison with 0 mg LPS/kg.

