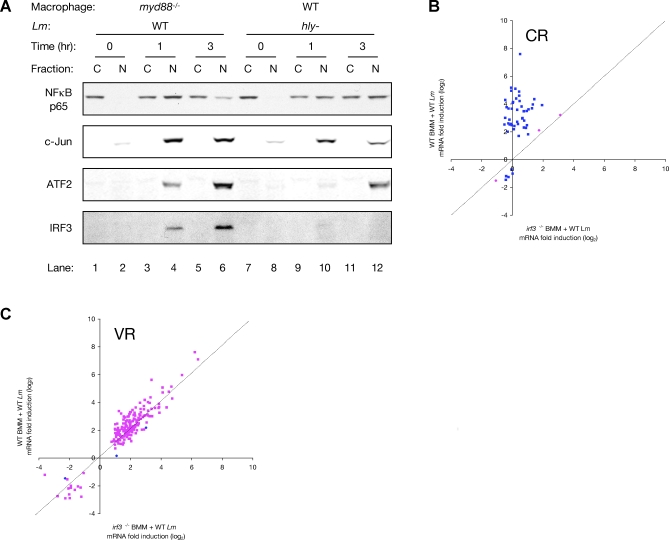
Figure 3. Specificity of the Cytosolic and Vacuolar Responses.
(A) Western blot analysis of the distribution of transcription factors NFκB p65, phospho-c-Jun, phospho-ATF2, and IRF3 in fractionated lysates of myd88 −/− or WT macrophages infected with WT or hly− L. monocytogenes, respectively, for the indicated times (in hours). “C” indicates cytosolic fractions and “N” indicates nuclear fractions. Data is from the pooled lysates of two independent dishes.
(B) Scatter plot representation of the transcriptional response of WT and irf3 −/− macrophages infected for 3 hours with WT L. monocytogenes, as determined by microarrays. Shown are the responses of Cytosolic Response-specific target genes. Y-axis values are log2 fold change in RNA abundance in WT macrophages infected with WT L. monocytogenes. X-axis values are log2 fold change in RNA abundance in irf3 −/− macrophages infected with WT L. monocytogenes. The superimposed dashed line has a slope = 1. Spots in blue are those identified by SAM as being significantly differently induced in the two conditions, while spots in pink are not different.
(C) Scatter plot representation of the transcriptional response of WT and irf3 −/− macrophages infected for 3 hours with WT L. monocytogenes, as determined by microarrays. Shown are the responses of Vacuolar Response-specific target genes. Y-axis values are log2 fold change in RNA abundance in WT macrophages infected with WT L. monocytogenes. X-axis values are log2 fold change in RNA abundance in irf3 −/− macrophages infected with WT L. monocytogenes. The superimposed dashed line has a slope = 1. Spots in blue are those identified by SAM as being significantly differently induced in the two conditions, while spots in pink are not different.

