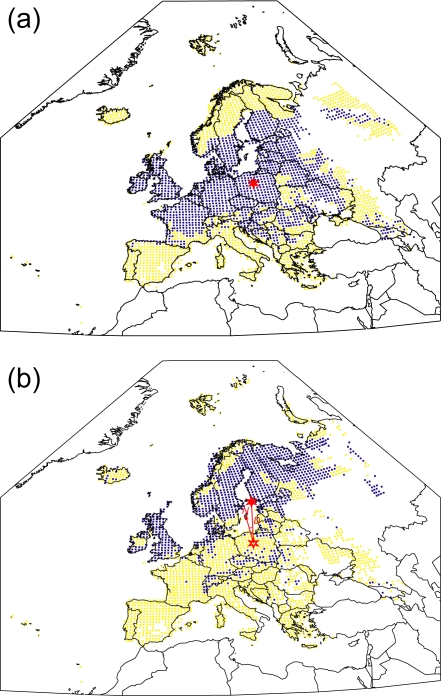
Figure 1. Simulated present and potential future ranges of Locustella naevia.
(a) Simulated distribution of Locustella naevia (Grasshopper Warbler) in Europe for the ‘present’ (1961–90) climate. Blue symbols represent grid squares simulated as suitable, yellow symbols grid squares simulated as unsuitable, and white areas of the map regions with climatic conditions unlike those anywhere where data for the species are available in the EBCC dataset [6]. The red star indicates the position of the centroid of the species' simulated range. The response surface model has a ‘high’ performance (AUC = 0·952) as assessed by its ability to describe the observed distribution as recorded in the EBCC atlas [6]. (b) Simulated potential distribution of Locustella naevia in Europe for the HadCM3 B2 future climate scenario (2070–99). Blue and yellow symbols, and white areas of the map, as in (a). For this climate scenario the species' potential future range extent, in terms of potentially suitable grid squares, is 66% of the extent of its simulated present range. The area of overlap of the simulated future potential and present ranges is 37% of the extent of the latter. The red star indicates the position of the centroid of the species' simulated potential future range; the red star outline indicates the position of the centroid of the species' simulated range for the ‘present’ climate. The line joining these two stars, length D (808 km), represents the geodesic path between the two centroids. Also plotted is a line indicating the direction of north (N) from the centroid of the species' simulated range for the ‘present’ climate; the angle θ (10·6°) between north and the geodesic path between the two centroids is the initial azimuth of the geodesic path.

