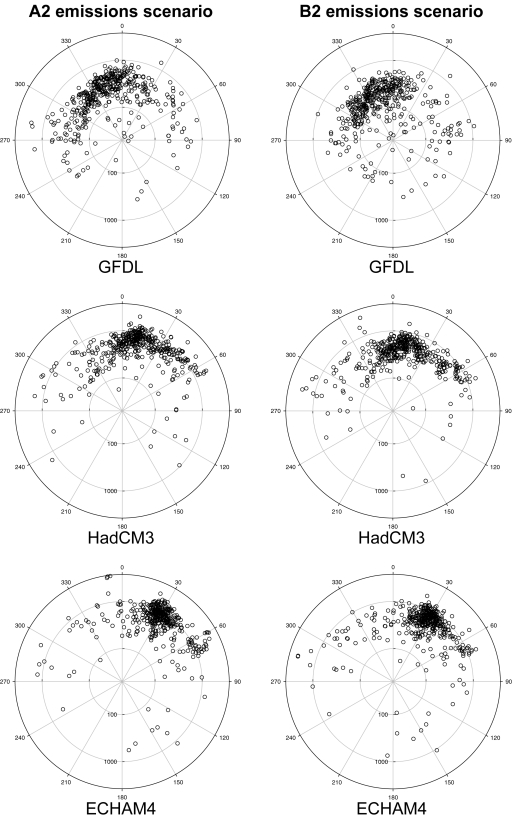
Figure 2. Polar plots of potential range centroid displacement.
The distance and direction of each species' potential range centroid displacement (see Figure 1) is illustrated for the six potential future climate scenarios, each point in each plot representing an individual species. The radial distance from the centre of the plot at which a point is located indicates the geodesic distance (D) between the centroids of its simulated present and potential future ranges; the angular position of a point indicates the initial azimuth (θ) of the geodesic path between the present and potential future range centroids as a bearing relative to North (0°). The same logarithmic scale is used to plot radial distances in all six plots; the centre point of each plot represents a geodesic distance of 20 km, whilst their circumferences correspond to a distance of 3750 km.

