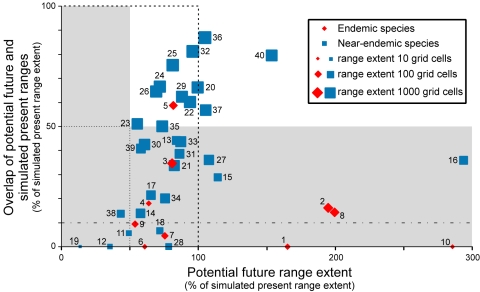
Figure 3. Overlap vs relative extent of potential future range.
The percentage of the present simulated range that is projected to remain climatically suitable is plotted against the extent of the future potential range expressed as a percentage of the simulated present range. Each point represents one of the ten bird species endemic to Europe (red diamonds) or one of the 30 species that are nearly so (blue squares) for which models could be fitted. Numbers identify species (see Table below). Results shown are for the HadCM3 B2 scenario. The size of the symbols is proportional to the log of the simulated present range extent. Dashed lines indicate the ‘no-change’ value of 100% for overlap and relative extent. Zones with overlap and/or relative extent <50% are shaded and bounded by dotted lines. The dot-dashed line bounds the zone with overlap <10%.
Key to numbers used to identify species in Figure 3
Endemic species 13 Phalacrocorax aristotelis 27 Turdus torquatus
1 Aquila adalberti 14 Milvus milvus 28 Acrocephalus paludicola
2 Alectoris graeca 15 Accipiter brevipes 29 Acrocephalus palustris
3 Alectoris rufa 16 Falco eleonorae 30 Hippolais icterina
4 Stercorarius skua 17 Porzana parva 31 Sylvia undata
5 Anthus petrosus 18 Larus melanocephalus 32 Sylvia atricapilla
6 Sylvia balearica/S. sarda 19 Larus audouinii 33 Regulus ignicapillus
7 Cyanopica cyanus 20 Picus viridis 34 Ficedula albicollis
8 Passer × italiae 21 Dendrocopos medius 35 Parus cristatus
9 Serinus citrinella 22 Lullula arborea 36 Parus caeruleus
10 Loxia scotica 23 Anthus pratensis 37 Certhia brachydactyla
Near-endemic species 24 Prunella modularis 38 Sturnus unicolor
11 Calonectris diomedea 25 Erithacus rubecula 39 Loxia pytyopsittacus
12 Puffinus yelkouan 26 Saxicola rubetra 40 Emberiza cirlus

