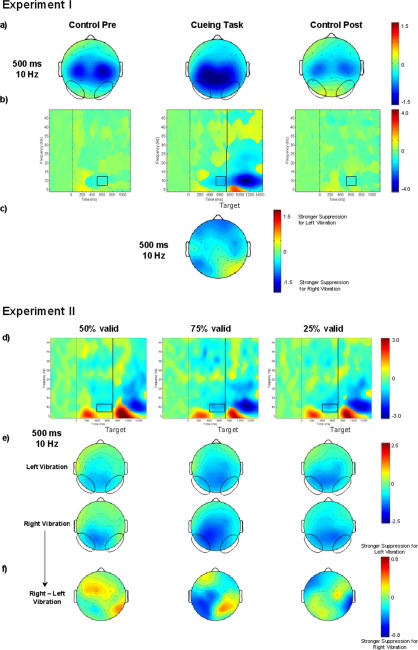
Figure 2. Grand average of occipital time-frequency modulations in experiments I+II.
a)+e) 2-D topographies of the alpha-rhythm suppression in the ISI (500 ms, 10 Hz) are plotted. Ellipses enclose the occipital regions of interest. b+d) Grand averages of time-frequency matrices for the occipital regions of interest for the cueing task and the control tasks (b) separately for the three validity conditions (d). Zero on the x-axis corresponds to the onset of the S1 stimulus. The black vertical line in the results of the cueing task marks the onset of the S2 stimulus. Black squares designate the time-frequency window in which the alpha-rhythm suppression was analyzed. c+f) The topography plots illustrate the laterality of the alpha-rhythm suppression in the cueing task. The amount of stimulus-locked oscillations at various times and frequencies relative to the pre-stimulus baseline is color-coded and is expressed in db. In a), b), d), and e) positive values indicate an increased, while negative values indicate a decreased amount of stimulus-locked oscillations. In c) and f) positive values indicate stronger alpha-rhythm suppression after left than after right finger stimulation, while negative values indicate stronger alpha-rhythm suppression after right than left right finger stimulation.

