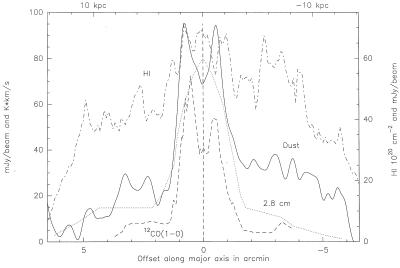
Figure 2.
Cuts along the major axis; the CO and the 2.8 cm data were provided by G. Golla (14, 18), and the Hi curve was extracted from a map supplied by R. Rand (8). The left axis gives the units for the dust and CO emission, the right axis for Hi and cm continuum. Similar to the galaxies NGC 4565 (6) and 5907 (7), the profiles of the CO and the cm continuum drop off more steeply than that of the dust and the Hi. Note, however, that such cuts are one-dimensional and miss emission that is close to, but not on, the major axis.

