Figure 4.
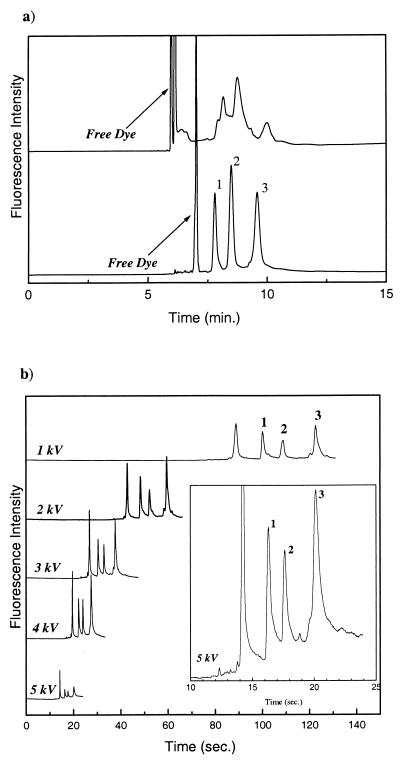
Electropherograms of three cysteine-containing, fluorescently labeled proteins (peak 1, calmodulin with an apparent MM of 9 kDa; peak 2, lysozyme (hen egg white) with a MM of 14.5 kDa; peak 3, staphylococcal nuclease 16-cys mutant with a MM of 18 kDa). (a) Capillary-based SDS/CGE with the proteins labeled nonspecifically with fluorescein-NHS (Top) or labeled specifically with fluorescein-MAL (Bottom). Capillary: 100-μm i.d. × 20 cm (27 cm total length) uncoated fused-silica. Separation voltage: 8.1 kV. Injection: 4 kV for 30 s. Note the two different free dyes migrate differently under identical separation conditions. (b) Chip-based SDS/CGE of the specifically labeled proteins with different separation voltages. The Inset highlights the three well resolved protein peaks at a separation voltage of 5 kV. Each protein concentration in the mixture was estimated to be ≈1 × 10⁻⁹ M to 10 × 10−9 M.

