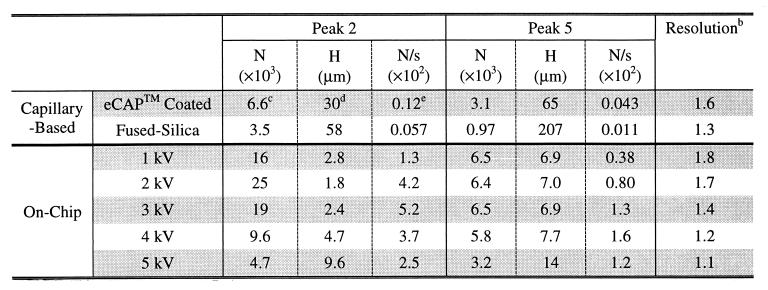
Table 1.
Comparison of capillary-based vs. chip-based SDS/CGE for nonspecifically labeled proteinsa
b For peaks 3 and 4, the resolution was calculated by using the expression R = 2 × (t3 − t4)/(Δt1/2,3 + Δt1/2,4), where t3 and t4 are the migration times of peaks 3 and 4 and Δt1/2,3 and Δt1/2,4 are the respective full widths at half maximum.
c Theoretical plate numbers (N) were calculated for peaks 2 and 5. These calculations were based on the measured full width at half maximum (Δt1/2) of a peak by using the expression N = 5.54 × (t/Δt1/2)2, where t is the migration time.
d Plate heights (H) are calculated by dividing the column length by the theoretical plate numbers. For CE-based separations, a column length of 20 cm was used. For chip-based separations, a column length of 4.5 cm was used.
e Theoretical plates per second (N/s) were calculated by dividing theoretical plate numbers (N) by migration time.

