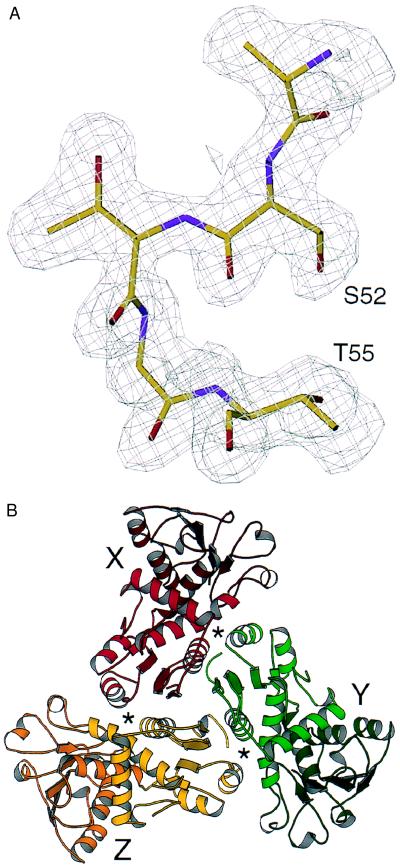
Figure 1.
Structure of the ATCase C trimer. (A) The quality of the electron density maps is illustrated by the 20- to 1.88-Å resolution, 2Fo-Fc map contoured at 1σ, showing residues of the phosphate-binding loop, Ser-52 through Thr-55. (B) Ribbon diagram (21) of the X (red), Y (green), and Z (gold) chains of the C trimer, viewed along the trimerization axis. The active sites, which contain residues from adjacent chains, are designated by asterisks.

