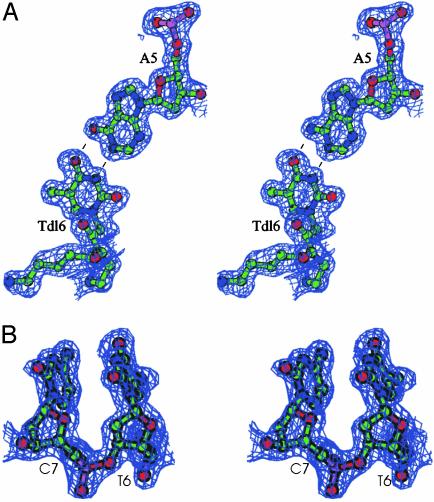
Fig. 4.
Simulated annealing omit |2Fo – Fc| electron density map, computed at 1.66 Å and contoured at 1.0 σ.(A) Representative Tdl6–A5 base pair engaged in Watson–Crick hydrogen bonds. (B) DNA residue T6 and C7 with the sugar moieties in the C3′-endo and C2′-endo conformation, respectively. The image was generated by using bobscript (38).

